Monitoring XTDB with Grafana
XTDB provides tools and templates to facilitate the monitoring and observability of XTDB nodes. Metrics are exposed in the Prometheus format, which can be scraped by Prometheus and visualized in Grafana using XTDB’s pre-built dashboards.
Prerequisites
Section titled “Prerequisites”You will need:
- A running Grafana instance
- Prometheus configured to scrape metrics from XTDB nodes
- Prometheus configured as a data source in Grafana
Refer to the official documentation for setup instructions:
Setting Up Grafana Dashboards
Section titled “Setting Up Grafana Dashboards”To import XTDB’s pre-built dashboards:
- In Grafana, navigate to
Dashboards → New → Import dashboard. - Upload the dashboard JSON file from the XTDB repository.
- Select the Prometheus data source and click
Import.
The following dashboards are available:
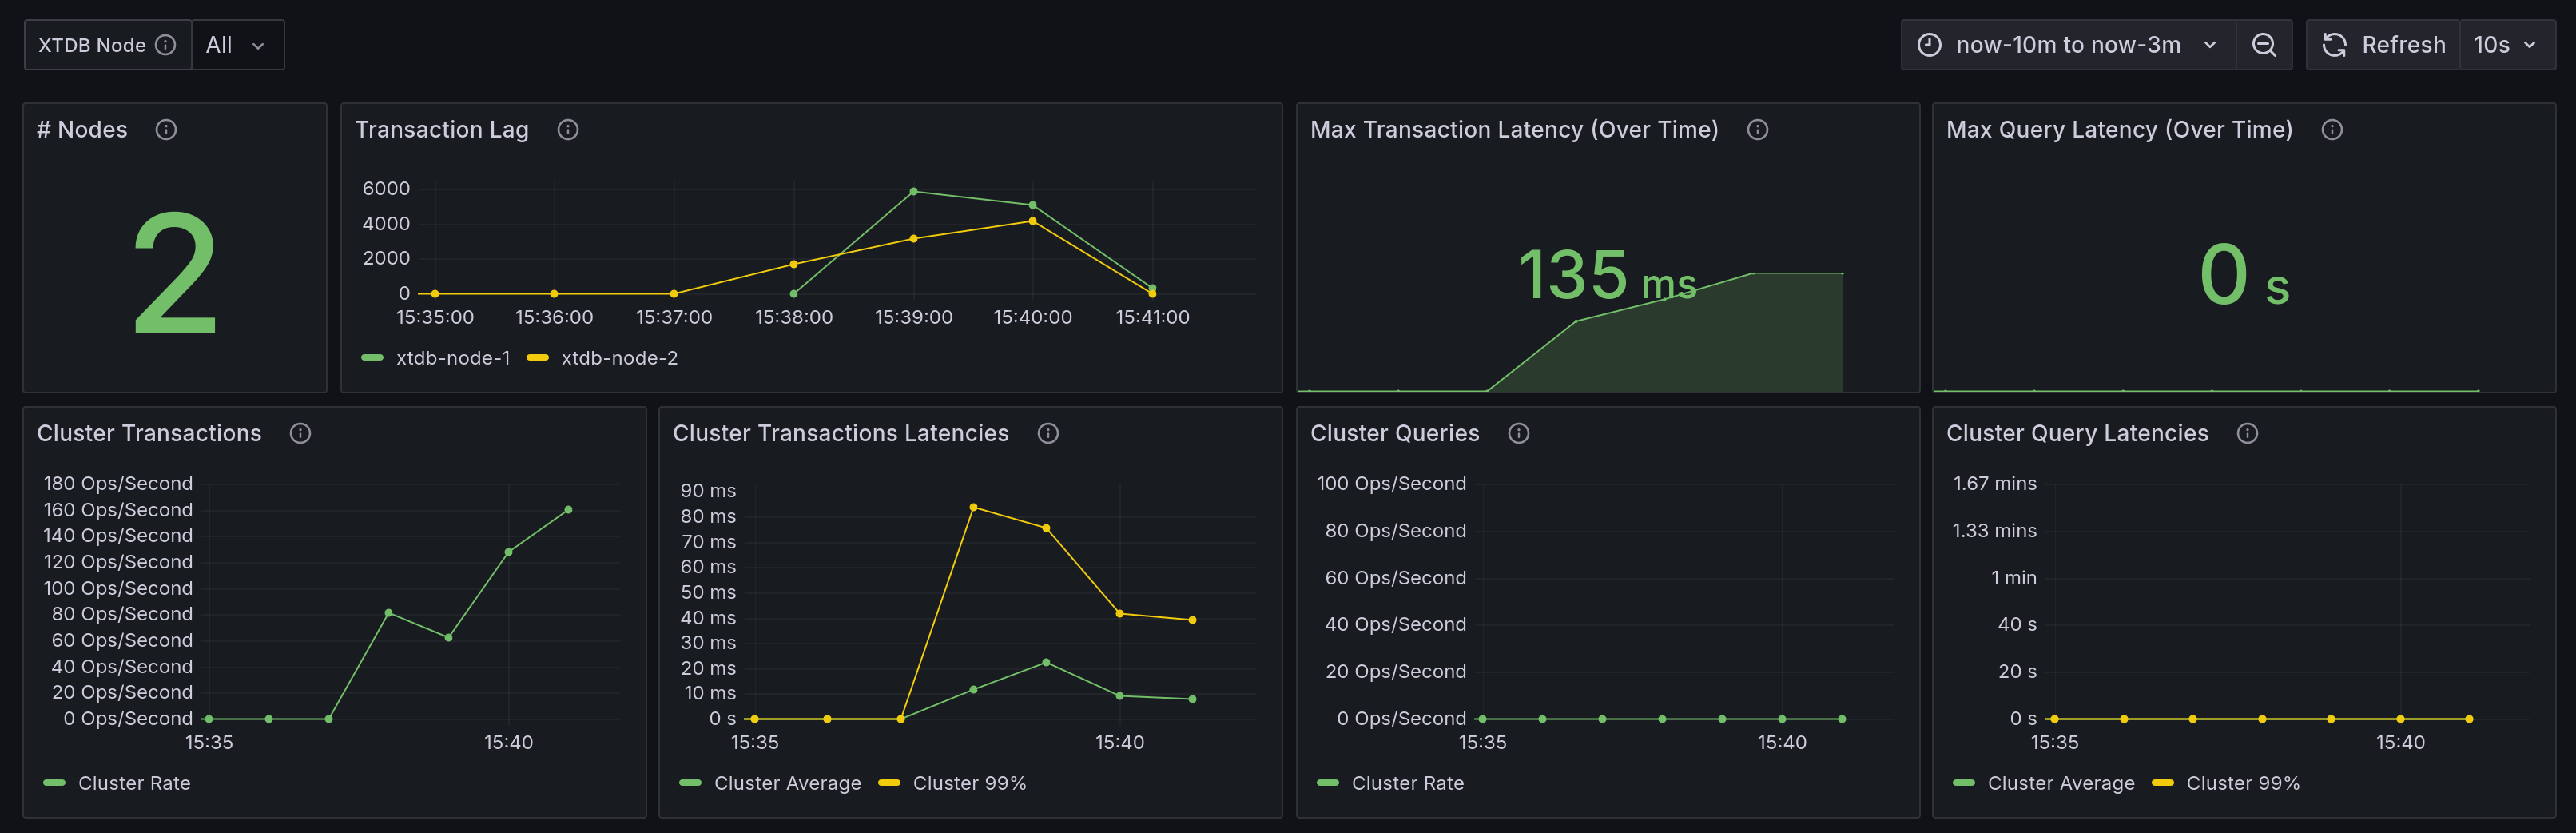
Cluster Monitoring Dashboard
Section titled “Cluster Monitoring Dashboard”Provides an overview of the entire XTDB cluster, including node health and performance.
Download the JSON template: here.
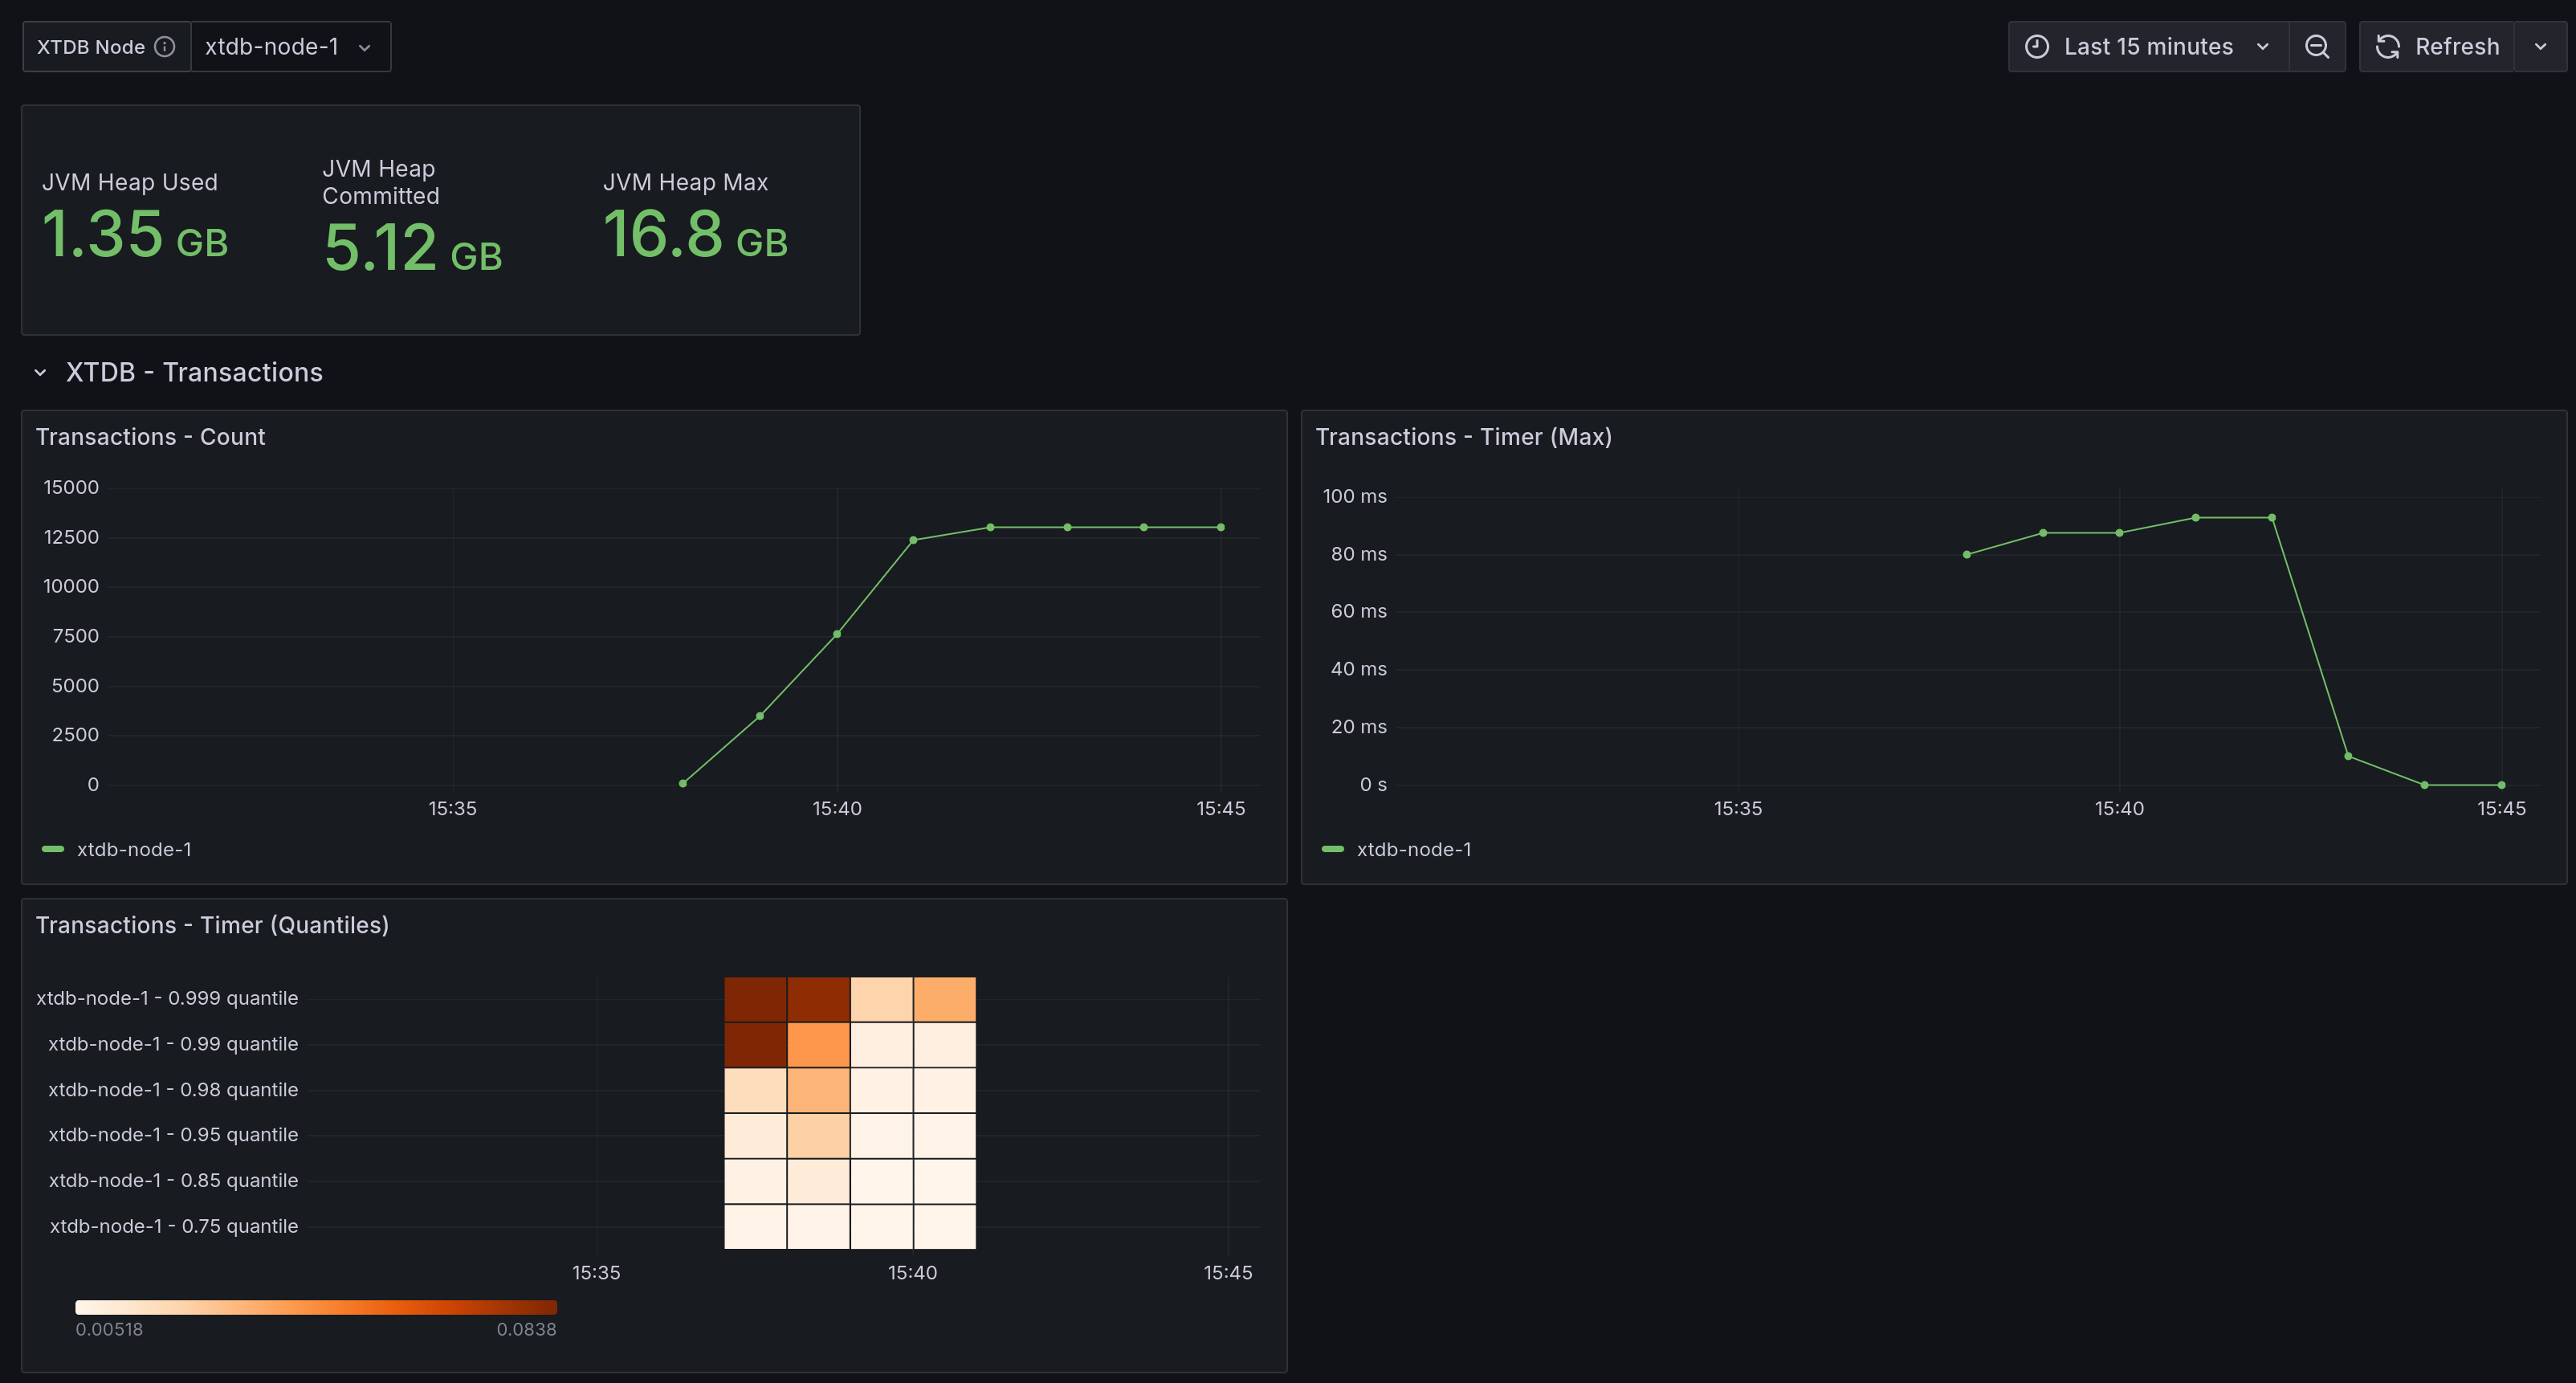
Node Debugging Dashboard
Section titled “Node Debugging Dashboard”Focuses on individual XTDB nodes, showing metrics such as resource usage, performance, and health.
Download the JSON template: here.
Distributed Tracing with Tempo
Section titled “Distributed Tracing with Tempo”XTDB supports distributed tracing using OpenTelemetry, which can be visualized in Grafana using Grafana Tempo as the tracing backend.
Prerequisites
Section titled “Prerequisites”You will need:
- A running Tempo instance configured to receive OTLP traces over HTTP.
- Tempo configured as a data source in Grafana.
- XTDB node configured with tracing enabled.
Refer to the Tempo documentation for setup instructions.
Configuring XTDB for Tracing
Section titled “Configuring XTDB for Tracing”To enable tracing in your XTDB node, add the following to your node configuration:
tracer: enabled: true endpoint: "http://<tempo-host>:4318/v1/traces"See the Tracing configuration reference for more details.
Viewing Traces in Grafana
Section titled “Viewing Traces in Grafana”Once XTDB is configured and sending traces to Tempo:
- In Grafana, navigate to
Explore. - Select the Tempo data source.
- Use the query builder to search for traces by service name, operation, or other attributes.
- Click on individual traces to view detailed span information.
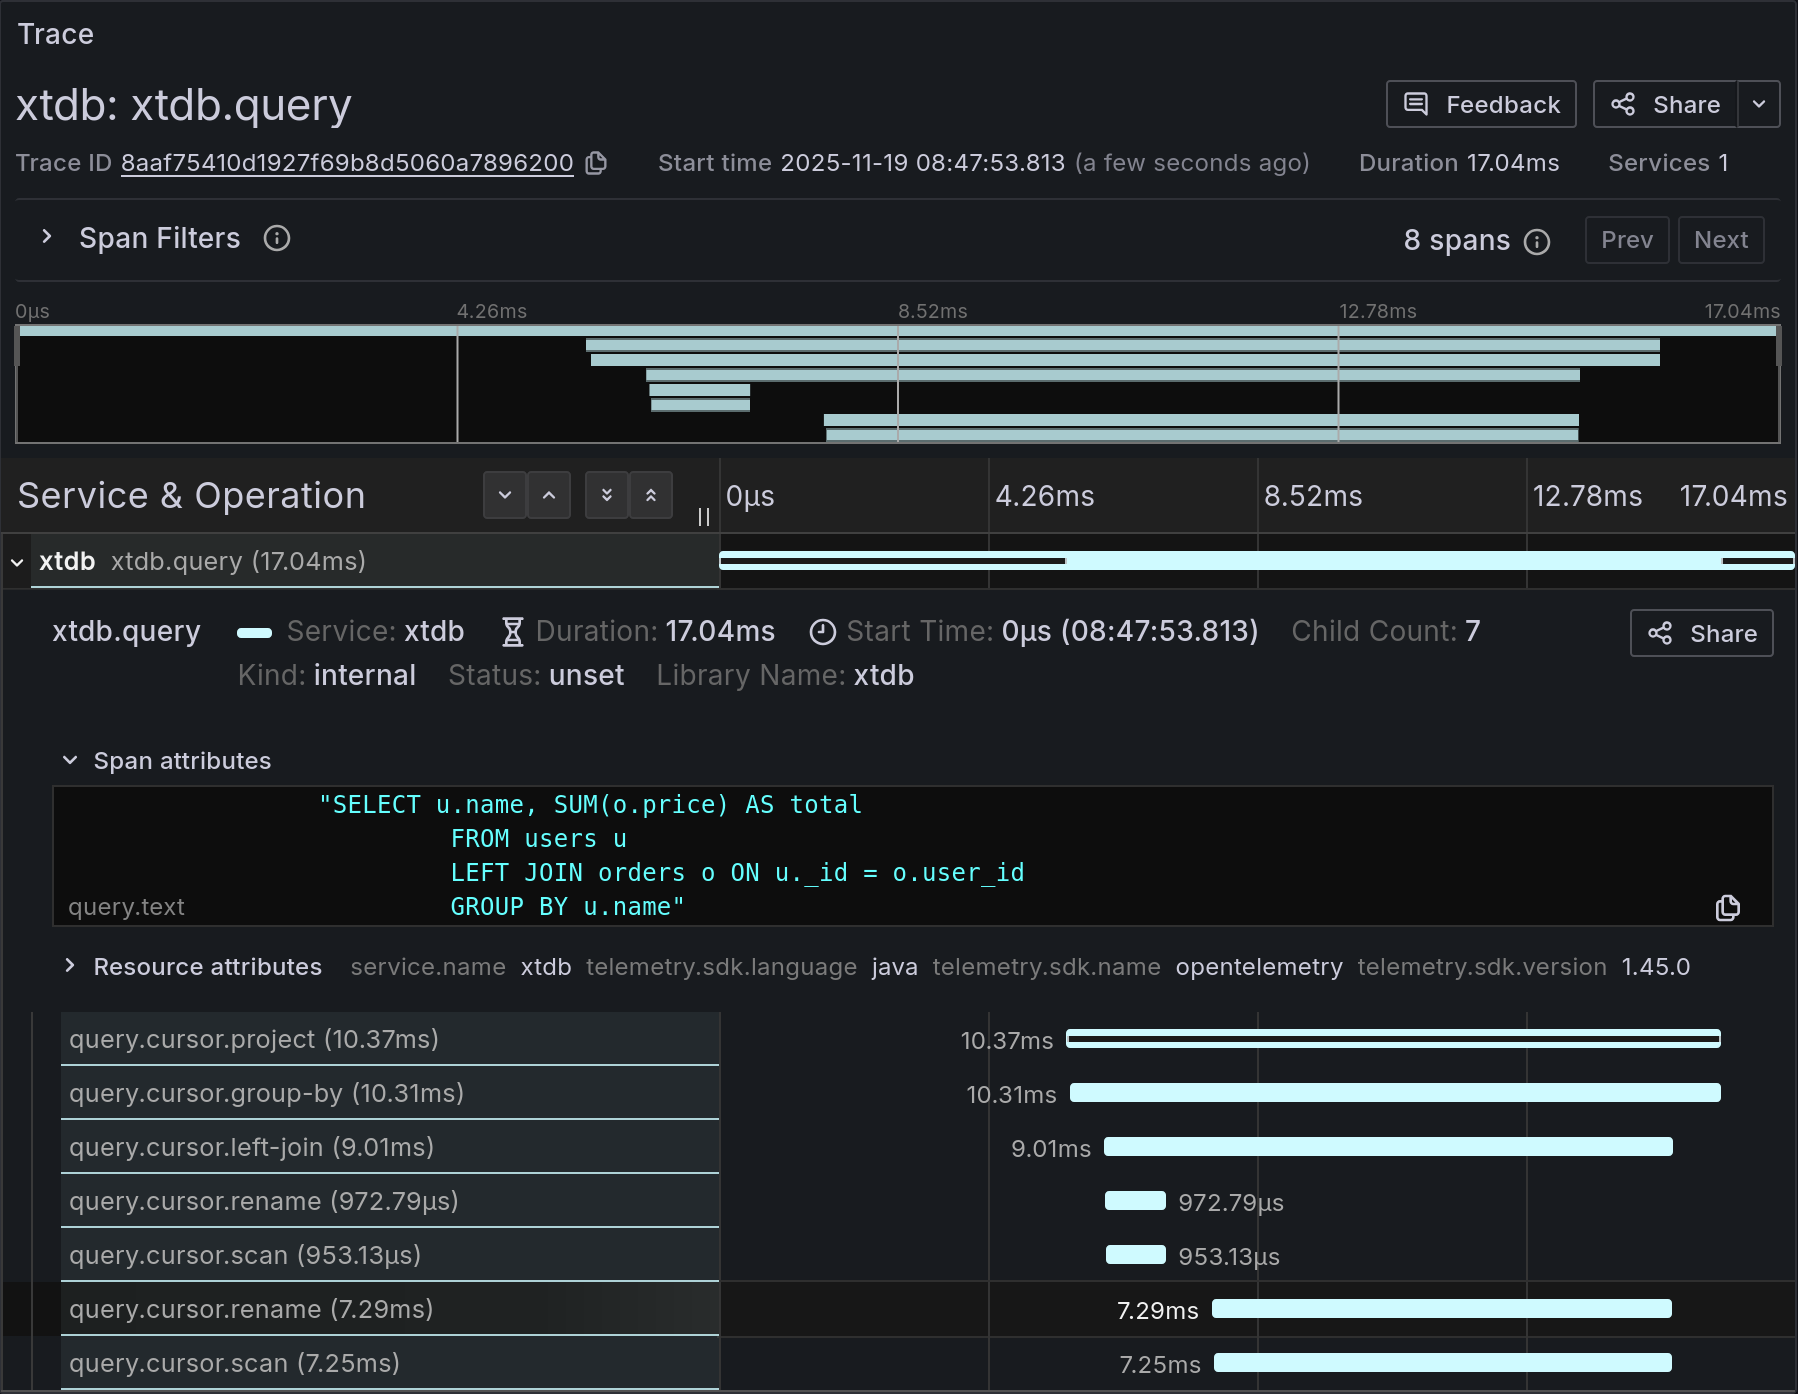
Tracing provides detailed introspection into query execution, including:
- Per-query execution times for performance analysis.
- Information on which queries were executed, available through the
xtdb.queryspan attributes. - Lower-level operation timings, revealing how time is distributed across individual query operations.